See How Much Prices Have Increased Since 2020 — In One Chart, With the Washington Decisions Behind It.
CNBC published a chart in December 2025 tracking the cost of living against a single fixed point: January 2020, the last full month before COVID-19 reshaped the American economy. The headline number was stark — overall consumer prices are up roughly 25%, more than double the cumulative inflation of the five years before the pandemic.
Some categories moved far more than that average, and a few moved less. Groceries and shelter climbed close to 30%. Gasoline swung wildly. Eggs became the single most erratic line item on any receipt in America. Used cars staged one of the sharpest boom-and-bust cycles the Bureau of Labor Statistics has ever recorded.
None of that happened in a vacuum. Behind the steepest segments of this chart sit specific spending bills, specific Federal Reserve decisions, and specific administrations that signed off on them — and the record shows most of the steepest climbing happened on one party’s watch.
- ~25% — cumulative all-items CPI increase since January 2020, more than double the ~10% increase of the five years before it — CNBC analysis of BLS data, Dec. 2025
- Nearly 30% — grocery ("food at home") and shelter price increases since 2020 — BLS Consumer Price Index sub-indices
- $1.9 trillion — the American Rescue Plan Act, signed March 11, 2021, by President Biden (D) — the stimulus economists warned would overheat the economy
- 0%–0.25% → 5.25%–5.50% → 3.50%–3.75% — the Fed funds rate's round trip, March 2020 to June 2026 — Federal Reserve
The chart itself is simple: index every month’s CPI reading against January 2020 and plot the cumulative gain. By CNBC’s December 2025 count, drawn straight from BLS’s own all-items index, overall prices were up about 25% — a pace more than double the roughly 10% cumulative inflation of the five years that preceded the pandemic. That comparison is the whole point of the chart: this was not a normal decade of gradual price creep. It was a five-year sprint layered on top of a slow walk.
BLS’s most recent report, released July 14, 2026 and covering June 2026, shows the climb has not leveled off into the background noise of a healthy economy. The all-items index was still up 3.5% over the prior twelve months — nearly double the Federal Reserve’s 2% target — even after a 0.4% monthly decline that was the largest one-month drop since April 2020.
That single number, though, flattens a lot of variation underneath it. The categories that make up a typical household budget did not all move together, and several of them moved far harder than the headline figure suggests.
Groceries — what BLS calls “food at home” — are up close to 30% since early 2020, according to the agency’s own sub-index. Eggs are the volatile outlier inside that category: BLS’s companion average-price data put a dozen Grade A eggs at $1.33 in mid-2020; prices spiked past $6.23 at the worst of a 2025 avian-flu cull that wiped out tens of millions of egg-laying hens, then partly retreated as flocks were rebuilt. Egg prices have swung more than 100% within a single year at least twice since 2020 — a reminder that not every spike on this chart traces to fiscal or monetary policy. Sometimes it’s a virus in a henhouse.
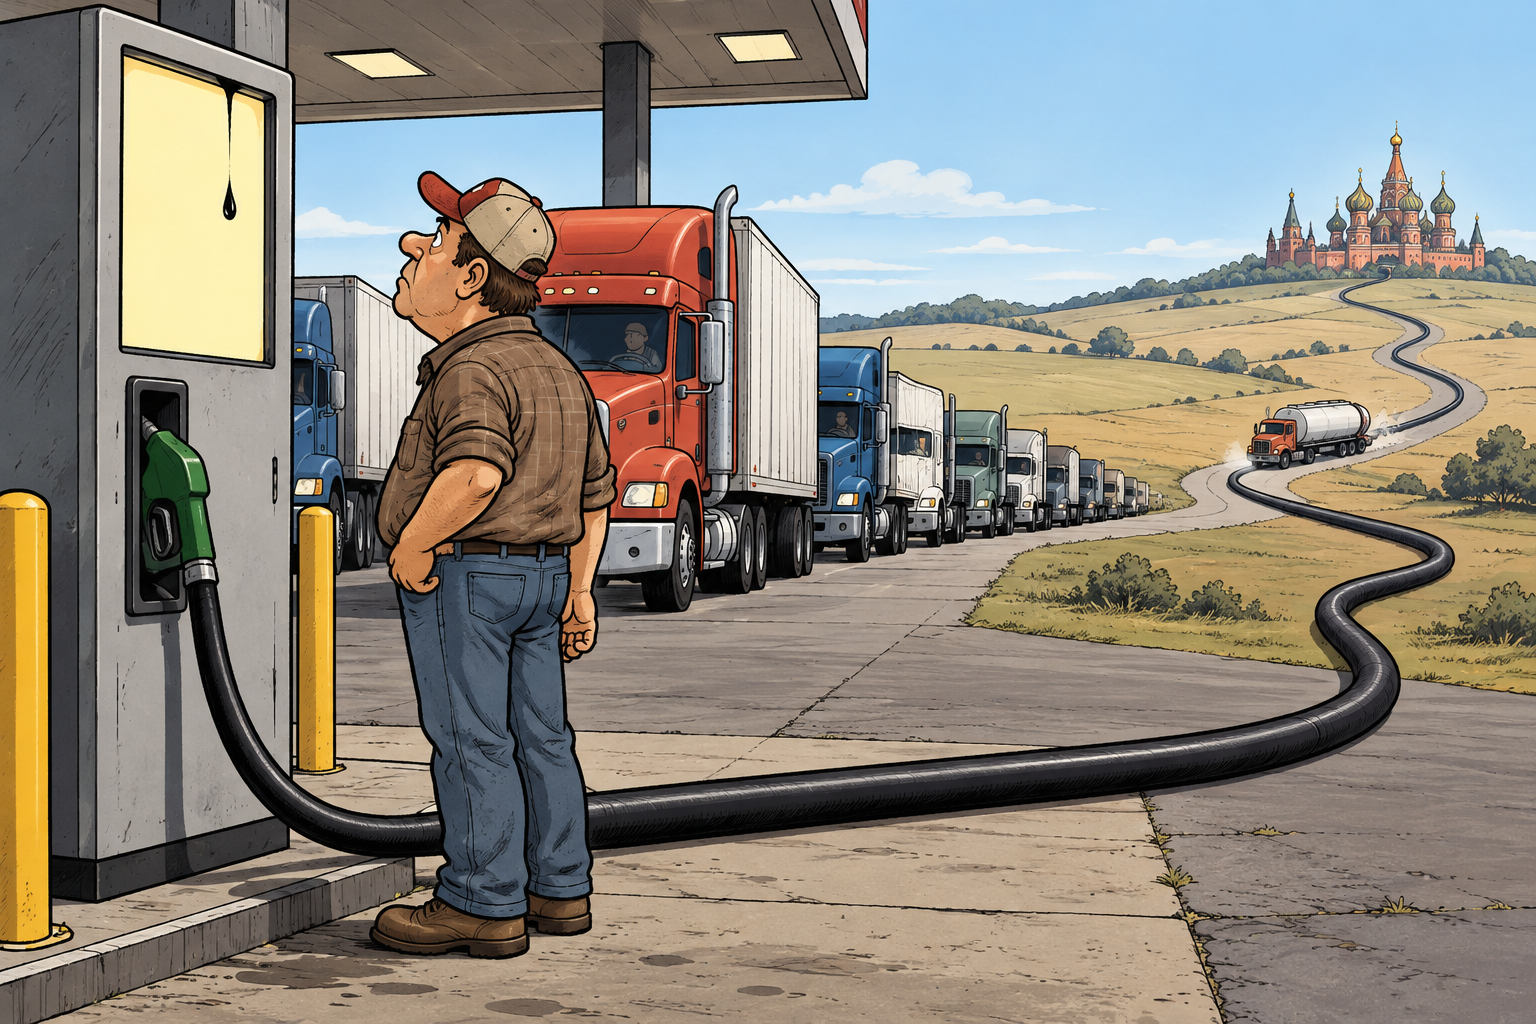
Gasoline has been the chart’s most volatile major line. Pump prices are still roughly 15% above January 2020 levels, but the path there was anything but smooth: gasoline spiked as high as 60% above pre-pandemic levels in June 2022, when Russia’s invasion of Ukraine hit global oil markets, before falling back sharply over the next two years. It reaccelerated again in 2026 amid the U.S.-Iran conflict — BLS’s June 2026 report puts gasoline 26.7% above where it stood a year earlier, even as prices eased slightly on a month-to-month basis that same month. Electricity has followed a steadier but still steep climb, up almost 30% since 2021 and 4.0% over the twelve months ending June 2026, outpacing overall inflation in most reporting periods since 2022.
Gasoline retailers must get their prices down, IMMEDIATELY! They're too high considering that oil is now at $68 a barrel, and heading south. The retailers must quickly react to this statement, and do what they know is right — DROP YOUR PRICE FOR OUR GREAT AMERICAN PEOPLE!
Paraphrased commentary · not a verbatim post
The first fiscal response to COVID was the $2.2 trillion CARES Act, signed March 27, 2020, by President Donald Trump (R), alongside a Federal Reserve that cut its benchmark rate to near zero. The steeper, longer-lasting climb came a year later. The $1.9 trillion American Rescue Plan Act, signed March 11, 2021, by President Joe Biden (D), landed on an economy that was already recovering — and prominent Democratic-aligned economists warned at the time that its scale risked exactly the outcome that followed.
@paulkrugman continues his efforts to minimize the inflation threat to the American economy and progressive politics by pointing to the fact that inflation surged and then there was a year of deflation after World War 2.
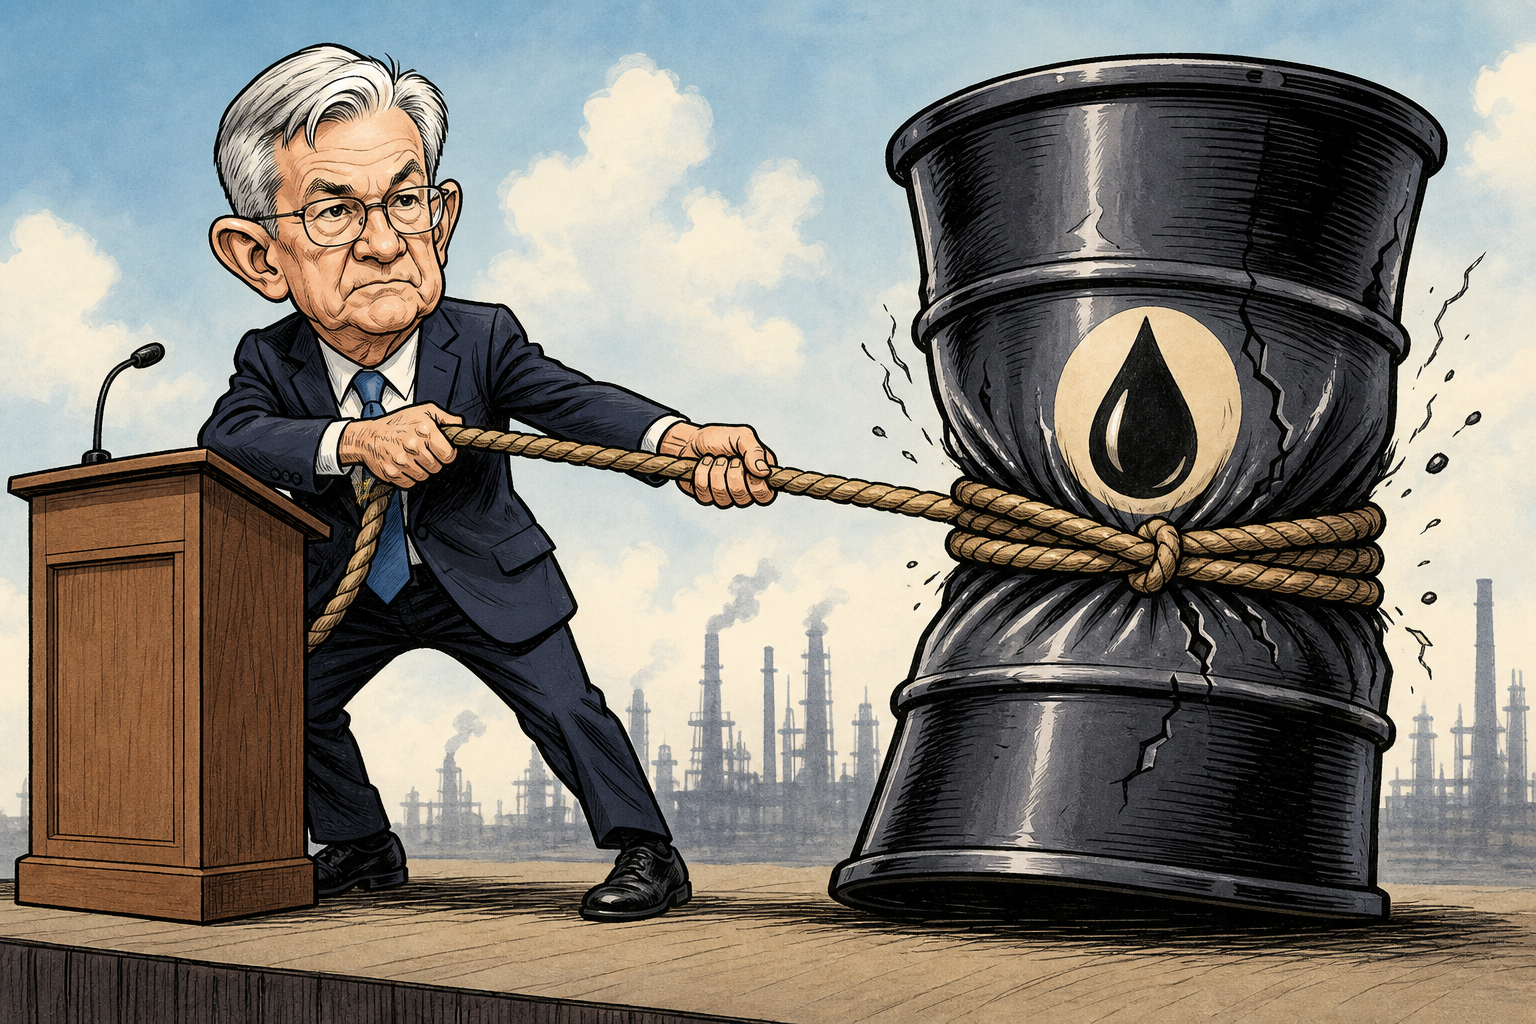
Summers, Treasury Secretary under President Clinton, was blunter still in real time. Fed Chair Jerome Powell — first nominated by Trump in 2017 and renominated by Biden in 2021 — held rates near zero through March 2022, then oversaw the fastest hiking cycle in decades, taking the federal funds rate to 5.25%–5.50% by July 2023. Biden signed a second major package, the $430 billion Inflation Reduction Act, on August 16, 2022; independent budget scorekeepers found its near-term effect on prices was negligible — its name described an intention, not a measured result. Treasury Secretary Janet Yellen (D-appointee) served throughout this stretch, from 2021 to 2025.
“This is the least responsible macroeconomic policy we've had in the last 40 years.”
Lawrence H. Summers · Former U.S. Treasury Secretary, on the American Rescue Plan
The administration when the sharpest climb began — President Joe Biden (D), whose $1.9 trillion American Rescue Plan (March 2021) and $430 billion Inflation Reduction Act (August 2022) coincided with the steepest two years on this chart.
The Fed throughout — Jerome Powell, nominated by a Republican president and renominated by a Democratic one, held rates near zero into 2022 before the fastest hiking cycle in decades.
Even the Democratic National Committee’s own numbers made this case by accident: a DNC social post attacking Trump-era grocery prices in 2025 used a chart that instead showed prices climbing sharply starting in 2021 and leveling off after 2024 — and was deleted within hours after widespread mockery.
Shelter is the largest single component of the CPI basket — roughly a third of the index by weight — and it has climbed more than 30% since 2020. Annual shelter inflation peaked above 8% in early 2023 before cooling to 3.3% as of June 2026, still well above its pre-pandemic pace. Used cars tell the sharpest boom-and-bust story of any category: BLS’s index rose from 130 in January 2020 to 209 by June 2022, a roughly 60% spike driven by the global chip shortage, before rolling back close to half of that gain as production normalized. Used vehicle prices were still down 2.8% year-over-year as of March 2026 — one of the only major categories currently moving in the opposite direction of the headline number.
Overall hard to say built back better successfully. Macroeconomy was better in 2019 than 2024 (lower unemployment rate, lower inflation, less debt, lower interest rates). Poverty was lower in 2019 and inflation-adjusted incomes higher.
Leadership at the Fed has since changed hands. Powell’s term as chair ended May 15, 2026; he stayed on briefly as chair pro tempore until Kevin Warsh, nominated by President Trump (R) in his second presidential term, was confirmed 54–45 — the narrowest margin since the modern confirmation process began in 1977 — and sworn in as the Fed’s 17th chair on May 22, 2026. The federal funds rate, which peaked at 5.25%–5.50% in 2023, had eased to 3.50%–3.75% by the FOMC’s June 2026 meeting. Treasury Secretary Scott Bessent (R-appointee) has served since January 2025.
White House Press Secretary Karoline Leavitt made a similar argument after an earlier, cooler-than-expected inflation report late last year.
Just as President Trump told Americans last night: inflation continues to fall, wages continue to rise, and America is trending towards a historic economic boom. Today's report shows that inflation came in far lower than market expectations.
I inherited a MESS from the Biden Administration — the worst inflation in history, and the highest prices our country has ever seen. Prices are coming down fast, and we are respected as a nation again.
Paraphrased commentary · not a verbatim post
CNBC’s chart is real and sourced straight to BLS: consumer prices are up roughly 25% since January 2020, more than double the pre-pandemic pace, with groceries and shelter running even hotter. The steepest two years of that climb line up with a $1.9 trillion stimulus signed by President Biden (D) in March 2021 and a Fed that held rates near zero into 2022 — decisions Democratic-aligned economists themselves warned against at the time. Gasoline and eggs answer to their own shocks, not any one administration’s policy, and BLS’s own June 2026 data show inflation still running above the Fed’s 2% target even as the numbers cool from their peak.