
Blue States Pay 52.5% More for Electricity Than Red States. Bad Decisions Make Bad Policy.
Take two of the bluest states in the country and stack them against three of the reddest. California’s residential electricity rate is 102 to 149percent higher than Oklahoma’s, Texas’s or Florida’s — more than double, state for state. Washington’s electricity rate, oddly, is not; it’s one of the cheapest in the country, for reasons in Section 5. But at the gas pump, both California and Washington charge 35 to 53percent more than Oklahoma, Texas or Florida — a gap AAA’s own daily survey confirms every day it runs.
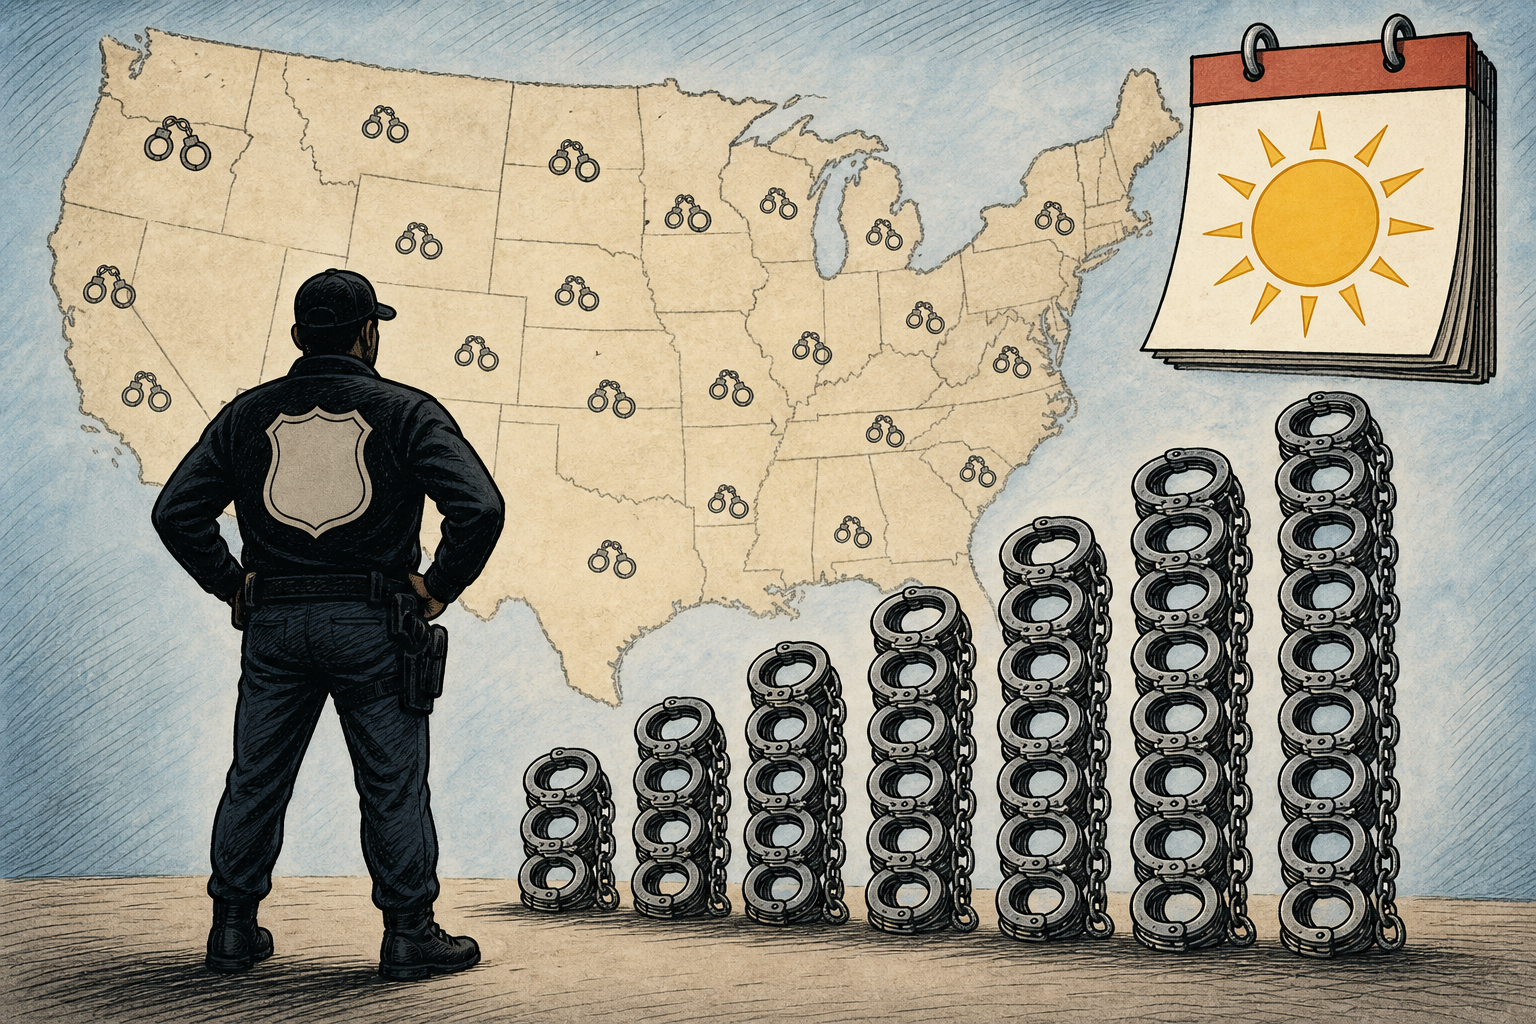
The Energy Information Administration’s newest state-by-state electricity data, covering May 2026 and released July 23, puts the average residential rate across the 19 states plus D.C. that voted for Kamala Harris in 2024 at 24.53 cents per kilowatt-hour. The 31 states Donald Trump carried average 16.08 cents — a 52.5 percent gap, or 8.45cents on every kilowatt-hour. Using the EIA’s own figure for a typical household’s usage, about 899 kilowatt-hours a month, that spread works out to roughly $75 a month, or $910 a year, before any other cost of living is counted.
Gas prices track the same direction, at a smaller scale. AAA’s daily survey puts the same 19 blue states plus D.C. at $4.28 a gallon of regular unleaded on average, against $3.96 across the 31 red states — a 31-cent, 7.9 percent gap. Four of the eight most expensive states in the country for gas are blue; all eight of the cheapest are red.
Neither gap is uniform. Alaska, a red state, pays electricity rates that rival Connecticut’s. Washington, a blue state, is one of the cheapest states in the country for power. Both numbers are real. Neither one, by itself, proves what’s causing it — which is exactly the fight playing out in Washington, D.C. right now.
Hawaii’s 52.00-cent rate is the extreme case, and the reason is straightforward: an islanded grid with no connection to any other state’s, running largely on imported oil. California is the more instructive one. At 33.25 cents, the state’s rate has climbed sharply since 2018, when it averaged roughly 16.6 cents, according to an Institute for Energy Research/Always On Energy Research analysis of the same EIA data series. Its own ratepayer advocate, the CPUC’s Public Advocates Office, says wildfire mitigation and liability now account for about 19 percent of an average residential bill — roughly $490 a year — with PG&E alone carrying more than $30 billion in wildfire liabilities. Gov. Gavin Newsom (D) has overseen that climb. New York, Rhode Island, Massachusetts, Connecticut and New Hampshire cluster between 27 and 30 cents, all members of the 11-state Regional Greenhouse Gas Initiative, a cap-and-trade program for power-plant carbon emissions.
The cheapest states run the opposite story. Idaho’s 12.35 cents is the nation’s lowest, powered heavily by hydroelectric dams; Utah, Oklahoma, Nebraska, Nevada, North Dakota and Missouri all sit under 14 cents, none of them RGGI members and none carrying a binding 100 percent clean-electricity mandate. New Mexico, at 14.12 cents, is the exception worth naming here — a blue state with its own 100 percent clean-electricity mandate that still lands in the eight cheapest states in the country, undercutting any claim that the mandate alone explains the gap. Energy Secretary Chris Wright (R) has put a number on the broader pattern anyway, telling Congress on June 10, 2026: “If you look at the 28 states across the country that have renewable portfolio standards … those states on average have 50% higher electricity prices than the other 22 states that have not followed those policies” — a claim close to, though not identical to, the 52.5percent gap above, since RPS-adoption and 2024 voting patterns aren’t a perfect overlap.
California’s $5.58 average is built almost entirely out of policy layers stacked on top of the crude price. The state’s gasoline excise tax rose to 63.4 cents a gallon on July 1, 2026 under the automatic inflation escalator in 2017’s Senate Bill 1 — the highest state gas tax in the country. On top of that, the California Energy Commission’s own breakdown adds roughly 13 cents in state and local sales tax, about 24 cents for the state’s cap-and-trade program and 20 cents for its Low Carbon Fuel Standard, plus a small underground-storage-tank fee — more than $1.15 a gallon in state-imposed taxes and fees before a single barrel of crude is priced in, according to the California Fuels and Convenience Alliance.
California is also refining less of its own gas than it used to, and the two most recent closures trace at least partly to state regulation, not just market conditions. Valero cited high costs and an unusually strict regulatory environment when it shut the Benicia refinery, after years of regulatory pressure that included roughly $82 million in state and regional fines for air-quality and toxic-release violations and a $1.1 billion write-down of its California assets. Valero CEO Lane Riggs told analysts California’s “regulatory and enforcement environment is the most stringent and difficult of anywhere else in North America.” Phillips 66 announced its Los Angeles refinery closure days after Gov. Gavin Newsom (D) signed a law giving state regulators new power to set minimum fuel-inventory levels for refiners — though Phillips 66’s own executives said the decision reflected a broader expectation that refining in California would keep getting harder, not a direct response to that one law. Both companies also cited weak refining margins and falling gasoline demand as California pushes electric vehicles and renewable diesel, so the honest read is regulation plus economics together, not either alone. The state lost 10 refineries between 1985 and 1995 alone, a 20 percent capacity cut; the two 2025–26 closures drop capacity further, from roughly 1.6 million to about 1.48 million barrels a day. The California Energy Commission itself says the resulting shortfall “must be made up through marine imports of refined product,” while most of the state’s crude increasingly comes from Ecuador, Iraq and Saudi Arabia rather than domestic wells. It isn’t unique to California: Pennsylvania and the rest of the East Coast lost most of their refining capacity the same way, for their own mix of cost and regulatory reasons, closing the Marcus Hook, Trainer and old Sunoco Philadelphia refineries between 2011 and 2019. Regional refineries now supply only about 40 percent of the gasoline the Northeast burns, with the rest shipped in from the Gulf Coast and abroad — a reminder that declining domestic refining and rising import dependence hit at least one red state’s region just as hard as California’s.
The cheapest gas sits in the Gulf Coast and Southeast refining belt — Louisiana, Indiana, Alabama, South Carolina, Mississippi and Texas, all red, all under $3.64 a gallon. Three states, Indiana, Georgia and Utah, actively suspended their state gas tax for stretches of 2026 — an active tax choice, not just an absence of one.

The gap is real; the explanation is contested. Energy Secretary Wright has made the administration’s case directly: “Electricity prices have risen very fast in blue states with restrictive renewable portfolio standards,” he told Fox News. White House spokeswoman Taylor Rogers put it more bluntly in a February 2026 statement to CNN, saying blue states are “stubbornly choosing Green Energy Scam policies that are making electricity bills unaffordable.” An August 2026 index built by the Institute for Energy Research and Always On Energy Research found 86 percent of states with above-average electricity prices voted Democratic in both 2020 and 2024, and 90 percent of the ten cheapest voted Republican both years.
Blue states have had more than double the rise in electricity prices than red states. President Trump is fighting to make energy affordable, reliable and secure for all Americans.
Independent grid researchers push back on the single-cause version of that story. A CNN review published Feb. 2, 2026 found electricity prices climbing in every region, including double-digit jumps in red Ohio and purple Pennsylvania. Charles Hua of the nonprofit PowerLines, Brendan Pierpont of Energy Innovation, Harvard Law’s Ari Peskoe and Michigan Public Service Commission chair Dan Scripps all point to aging infrastructure, wildfire exposure and data-center demand as bigger drivers than clean-energy mandates alone; Scripps said an order keeping one coal plant running past its planned retirement cost Michigan ratepayers $80 million in its first four months. A 2026 MIT Sloan School study went further, finding renewable portfolio standards have “virtually zero impact on prices” and that utility-scale renewables are “associated with lower retail rates” — a direct rebuttal to Wright’s framing. PowerLines separately found utilities requested $31 billion in rate hikes nationwide in 2025 — roughly double 2024’s total — with red-state utilities among the filers.
The averages hold, but the exceptions are real and worth naming. Alaska, a red state, pays 28.23 cents per kilowatt-hour — nearly matching Connecticut — because remote communities run on shipped-in diesel, not because of any clean-energy mandate. Washington, a blue state with its own cap-and-invest carbon program, is one of the cheapest states in the country for power at 14.95 cents, almost entirely because of Columbia River hydropower sold near-cost by the federal Bonneville Power Administration — the same category of exception as New Mexico, above. Louisiana’s electricity rate remains one of the lowest in the country at 14.15 cents, but a monthly Entergy resilience surcharge — $3.67 today, rising to $7 by 2029 under the utility’s $1.9 billion grid-hardening plan — is pushing it upward for reasons that have nothing to do with climate policy. In New York, it was the state’s own environmental regulators who told a court that finalizing the cap-and-invest program’s emissions rules would mean “imposing extraordinary and damaging costs upon New Yorkers” — the same reasoning Gov. Kathy Hochul (D) cited when she shelved the program’s timeline in 2026.
And of the seven states Trump won by the narrowest margins in 2024, only Georgia has full Republican control of its state government; Arizona, Michigan, Nevada, North Carolina, Pennsylvania and Wisconsin are all divided — a reminder that “red state” and “unified conservative energy policy” are not the same claim, even when the price data lines up.
The topline gap is real and sourced two ways: blue states average 52.5 percent more for electricity and 31 cents more per gallon of gas than red states, using the same EIA and AAA data the industry itself relies on. What’s contested is the single-cause story. Wildfire liability, aging Northeast grids, islanded logistics in Hawaii and Alaska, and a wave of red-state storm-hardening and nuclear-construction costs all sit inside these averages alongside the renewable-mandate costs the administration points to. Both things are true at once.
- 01.
- 02.
- 03.AAA (Industry-standard)·State Gas Price Averages — regular unleaded, daily survey, pulled Aug. 17, 2026
- 04.
- 05.
- 06.CPUC Public Advocates Office (Primary)·Q2 2026 Electric Rates Report — California wildfire mitigation as ~19% of an average residential bill
- 07.CPUC Public Advocates Office (Primary)·Electric IOUs' Wildfire Cost Increases report — PG&E's $30B+ in wildfire liabilities
- 08.Entergy Louisiana (Primary)·Storm-cost FAQ — $1.9B grid-hardening plan and existing storm-recovery surcharges
- 09.
- 10.
- 11.
- 12.California Energy Commission (Primary)·Estimated Gasoline Price Breakdown and Margins — LCFS (~20¢) and cap-and-trade (~24¢) per-gallon cost estimates
- 13.
- 14.California Fuels & Convenience Alliance·"California's Gas Prices Explained" — full state tax/fee stack, over $1.15/gal
- 15.
- 16.
- 17.
- 18.
- 19.EHN (Environmental Health News)·General reporting on Phillips 66's Los Angeles refinery closure amid California regulatory changes
- 20.
- 21.
- 22.
- 23.
- 24.Institute for Energy Research / Always On Energy Research·"Blue States, High Rates" 50-state index, launched Aug. 12, 2026 — 86% of above-average-price states voted Democratic 2020 & 2024
- 25.Secretary Chris Wright (Primary — official X account)·"Blue states have had more than double the rise in electricity prices than red states..."
- 26.Rep. Andrea Salinas (Primary — official House press release)·"Rep. Andrea Salinas Confronts Department of Energy Secretary Wright" — Secretary Wright's full RPS-price quote, House Science Committee hearing, June 10, 2026
- 27.
- 28.PowerLines (nonprofit utility research group)·Utilities filed $31B in rate-increase requests nationwide in 2025, red states included, more than double 2024's $15B
- 29.AP-called 2024 results (classification source)·State-by-state 2024 presidential winners — the standard red/blue shorthand used throughout this piece